Inequalities
| Solving Linear inequalities | Graphing a single inequality | Graphing multiple inequalities |
An inequality defines a set of different solutions and uses the four symbols below.
Graphing Inequalities (single)
Move the cursor over the numbers below the diagram to see the graphic for the current step.
Step 1:
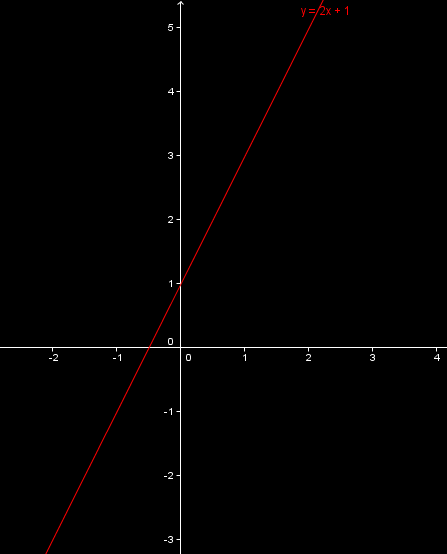
In order to graph the inequality $y\leq 2x+1$ begin by plotting it as if it were an equation. (see important note below)
In this case the graph of $y= 2x+1$ is drawn.Step 2:
The graph has now been split into two distinct areas.
In order to establish which of these is the required one, choose any point which is not on the line.Here the point $(3,2)$ has been marked.
This point is now tested to see if it satisfies the inequality.
$2\leq 2 \cdot 3+1 \\ 2 \leq 7$
Since this it is true, the point does satisfy the inequality.
Step 3:
If the chosen point does satisfy the inequality then the region which it is in should be shaded.
Otherwise, shade the region which does not contain the chosen point.
Important note:
In the above example, a solid line was drawn during Step 1.
This is done only when the inequality contains $ \leq$ or $\geq$.
A method must be used to distinguish these from when $<$ and $>$ are used.
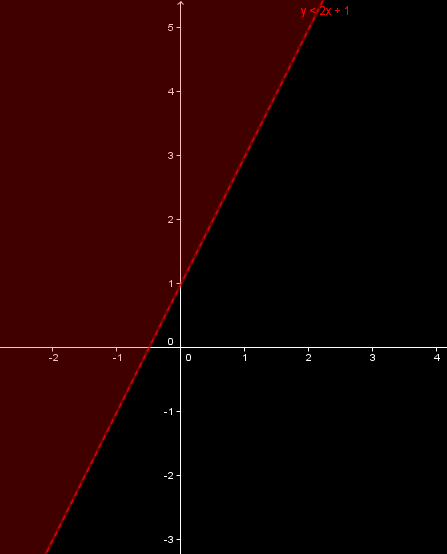
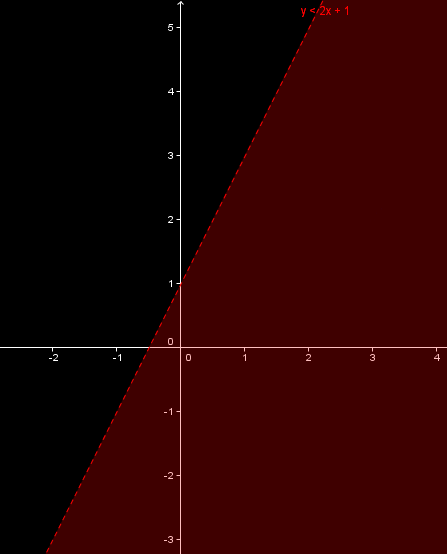
If the inequality had, instead, been $ y<2x+1$ then the line would have been drawn as a broken one, as shown opposite.
Graphing Inequalities (multiple)
the hard way
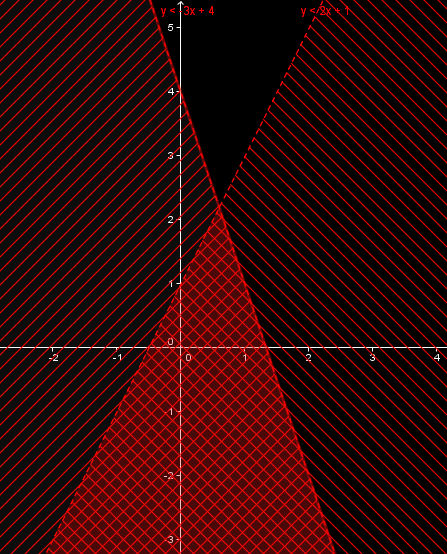
The diagram opposite shows the graphs of both
$y<-3x+4$ and $ y<2x+1$ .
(note that both lines are broken due to the '<' signs.)The area near the bottom shows the intersection of both inequalities.
While this is reasonably clear on a computer screen it is harder to reproduce on paper.When required to produce such a graph yourself, you should note which areas satisfy each of the inequalities and only shade the area required.
Move the mouse over the '2' to see how the final diagram should appear.

the easy way
Often an exam question will ask you to shade the area which is 'excluded '.
This makes the process much simpler.Step 1:
Plot the line as normal but shade in the area which does not satisfy the inequality.
Step 2:
Plot the second line and, again, shade in the area which does not satisfy the inequality.
As is required, the intersection of the two inequalities is the unshaded region.
Move the mouse over the '2' to see how the final diagram should appear.